Analytics & Business Intelligence

Dashboards leaders actually decide from.

What could your analysts do if they weren't buried in report requests? DataOps builds governed BI programs, the KPI frameworks, the data foundation, the dashboards, that turn reporting from a bottleneck into the way your organization decides.

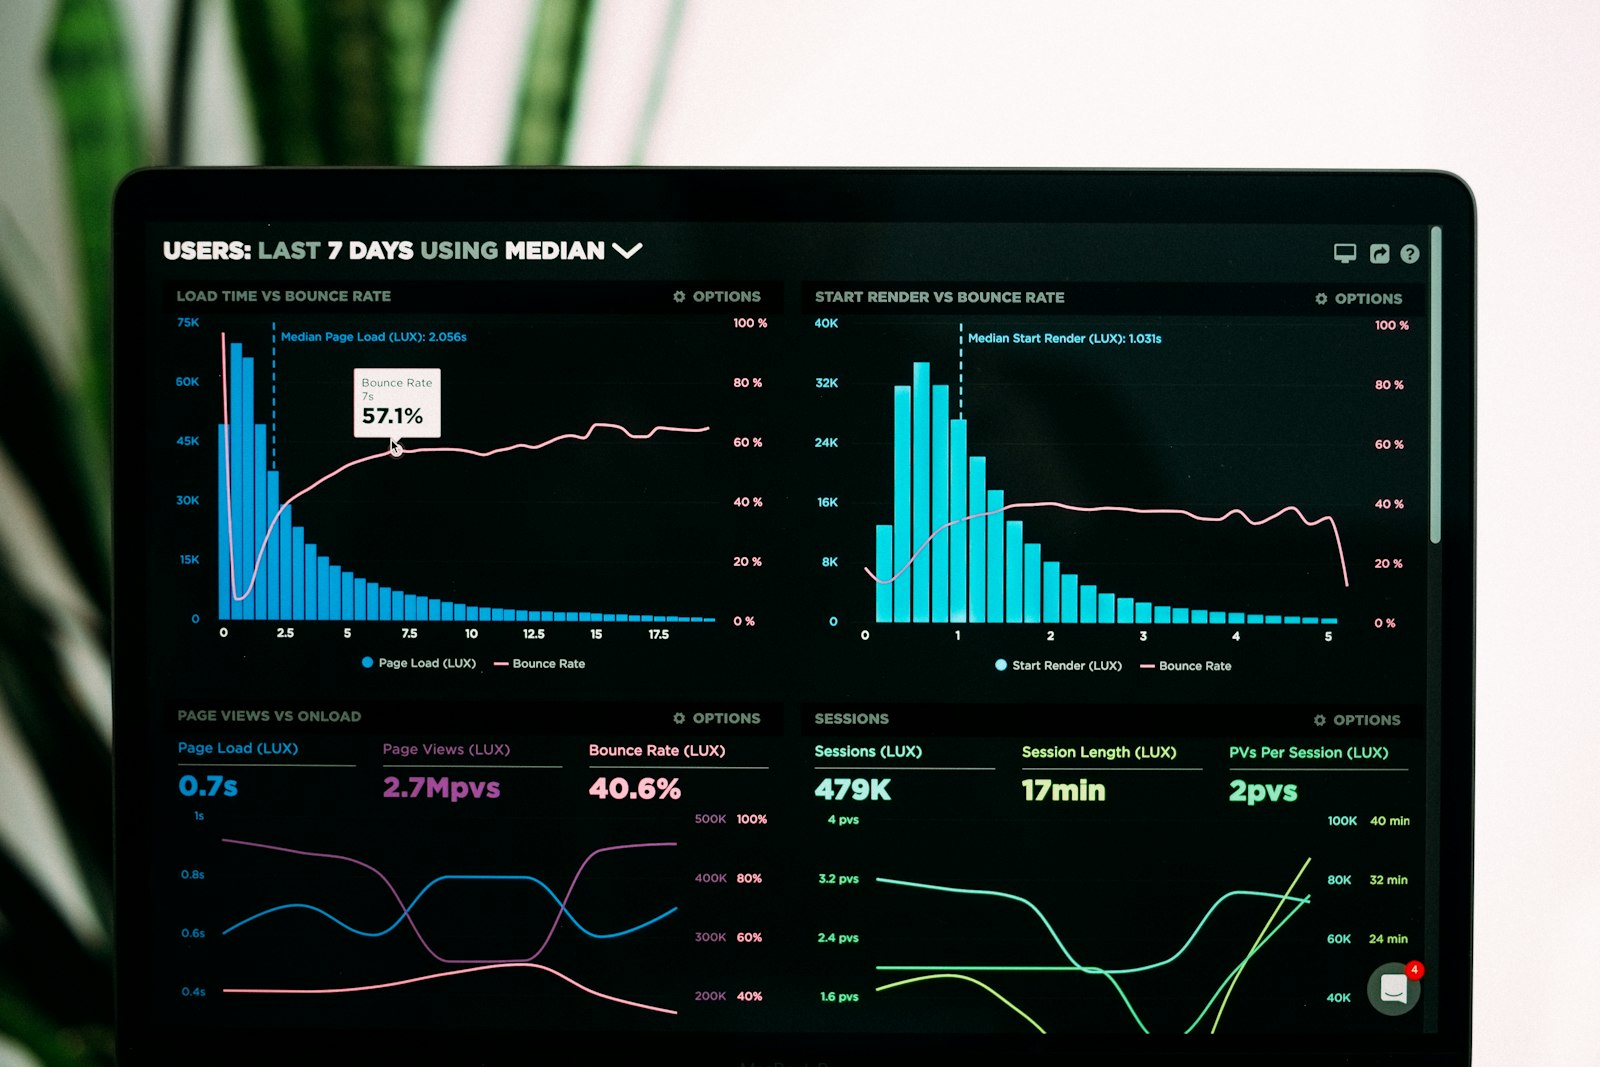
Analytics dashboard reviewed during a leadership working session
90%
Of analyst time reclaimed from report-building for client advisory roles
100%
Of Excel reports converted to governed Power BI at a $40B supplier
95%+
Dashboard on-time refresh at a $1.2B franchise, up from 72%
400M
Raw records curated through Bronze, Silver, and Gold layers
Sound familiar?

You don't have a dashboard problem. You have a trust problem.

Analysts spending 90% of their time building reports, not advising
Every department with its own version of the truth
Excel exports and Access databases quietly running the business
Dashboards nobody opens because nobody trusts them
KPIs that mean different things in every region
A BI tool bought before anyone agreed what to measure
01 What we build

Analytics as a decision system, not a report factory.

01

Dynamic Dashboards & Real-Time Insights

Governed Power BI dashboards leaders open every morning, built on certified data and refreshed on time, every time.

02

KPI Frameworks & Use Case Identification

One agreed definition per metric before the first visual is built, sequenced by the use cases that move the P&L most.

03

Data Modeling & Foundation

Bronze, Silver, and Gold layers that curate raw records into analytics-ready data products, proven at 400M-record scale.

04

Predictive Analytics & Model Deployment

Models that make it out of the notebook: deployed, monitored, and wired into the dashboards where decisions get made.

05

Legacy Modernization

Excel exports and Access databases retired for governed BI, the way we converted all Excel reporting at a $40B supplier.

06

Self-Service Enablement & Data Culture

Training and guardrails so the business answers its own questions, and analysts graduate from report builders to advisors.

02 The trust framework

How BI becomes something leaders believe.

Trusted analytics is engineered, not hoped for. Every dashboard we ship stands on the same four commitments.

01

One Governed Source of Truth

A single curated foundation replaces the spreadsheet exports and departmental copies, so every number traces to the same place.

02

Certified Data Products

Every dashboard is fed by certified data products, not ad-hoc queries, so what leadership sees is what the data actually says.

03

Quality Scores Visible to Consumers

DQE™ quality scores travel with the data, so consumers see exactly how trustworthy a number is before they act on it.

04

Analysts Freed for Advisory Work

With self-service handling routine questions, analysts move from 90% report-building to advising the business.

03 Proven results

What governed analytics does to operations.

Construction · $150M firm

Project analytics that pulled cycle times down across the board

Governed dashboards turned project health from anecdote into evidence. RFIs aging over 14 days fell from 28% to 8%, submittal cycle time dropped from 21 days to 12, and day-30 buyout completion climbed from 65% to 92%.

8%
RFIs aging over 14 days, down from 28%
12 days
Submittal cycle time, down from 21 days
Hospital building exterior Healthcare · $1.2B franchise

Dashboards corporate and franchisees both trust

Governed Power BI dashboards serving both corporate and franchisee audiences, with dashboard on-time refresh lifted from 72% to 95%+ and client survey completeness improved from 82% to 96%+.

95%+
Dashboard on-time refresh, up from 72%
96%+
Client survey completeness, up from 82%
04 Questions, answered

What leaders ask us about analytics and BI.

What does a BI consulting engagement deliver? +

Governed dashboards built on a curated Bronze/Silver/Gold data foundation, a KPI framework the business agreed to before the first visual was built, and an enablement program so your own team can extend it. At a $40B supplier we converted all Excel reporting to governed Power BI, and at a $1.2B healthcare franchise dashboard on-time refresh improved from 72% to 95%+.

Why don't people trust our dashboards? +

Because every department calculates its own version of the truth, KPIs mean different things in each region, and refreshes fail silently. Trust comes back when one governed source of truth feeds certified data products, and quality scores are visible to the people consuming the numbers.

Power BI or Tableau, does the tool matter? +

Less than you think. Governance matters more than tooling: a governed source of truth, agreed KPI definitions, and certified data products make either platform trustworthy, and neither works without them. We're certified in both, so the recommendation follows your organization, not our preference.

How long until we see working dashboards? +

Faster than a big-bang platform program. We sequence the highest-value use cases first and ship working dashboards while the Bronze/Silver/Gold foundation is built underneath them. The pace depends on the state of your source data, which is exactly what we assess in the first conversation.

Let's talk

Ready for dashboards people actually use?

Tell us which reports your team is rebuilding by hand every week. We'll show you what a governed BI program would change, and where to start.